PS IMAGO PRO
Statistical and Graphical Extension
for IBM SPSS Statistics
PS IMAGO PRO software enhances IBM SPSS Statistics, the world's most widely used statistical software, with additional procedures, charts, and features. The software includes a full license of IBM SPSS Statistics, featuring the familiar interface and all its standard functions, while further expanding its capabilities.
PS IMAGO PRO INCLUDES
The software consists of several components.
IBM SPSS Statistics
PS IMAGO PRO
PS IMAGO Designer
PS IMAGO Process
Data Preparation and Data Manipulation
Beyond the procedures found in IBM SPSS Statistics, PS IMAGO PRO offers additional data procedures and manipulations.
These include, for example, Multiply Cases (multiplying observations using a weight variable into a new data file), Join Files (loading multiple data files with immediate merging into a single data file), Create Calendar (generating a new data file based on a selected date), Reverse Coding (reversing the coding direction of categorical variables), and Dichotomous Coding (creating a dichotomous variable based on specific variable values), along with many others.
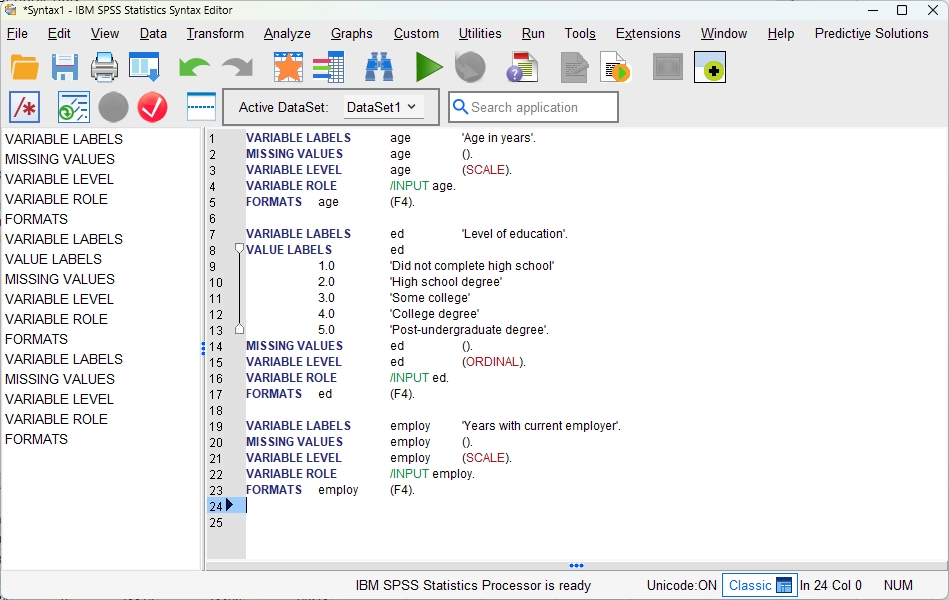
Data description – describes selected variables using syntax or creates a list of all (selected) properties of chosen variables in the output window.
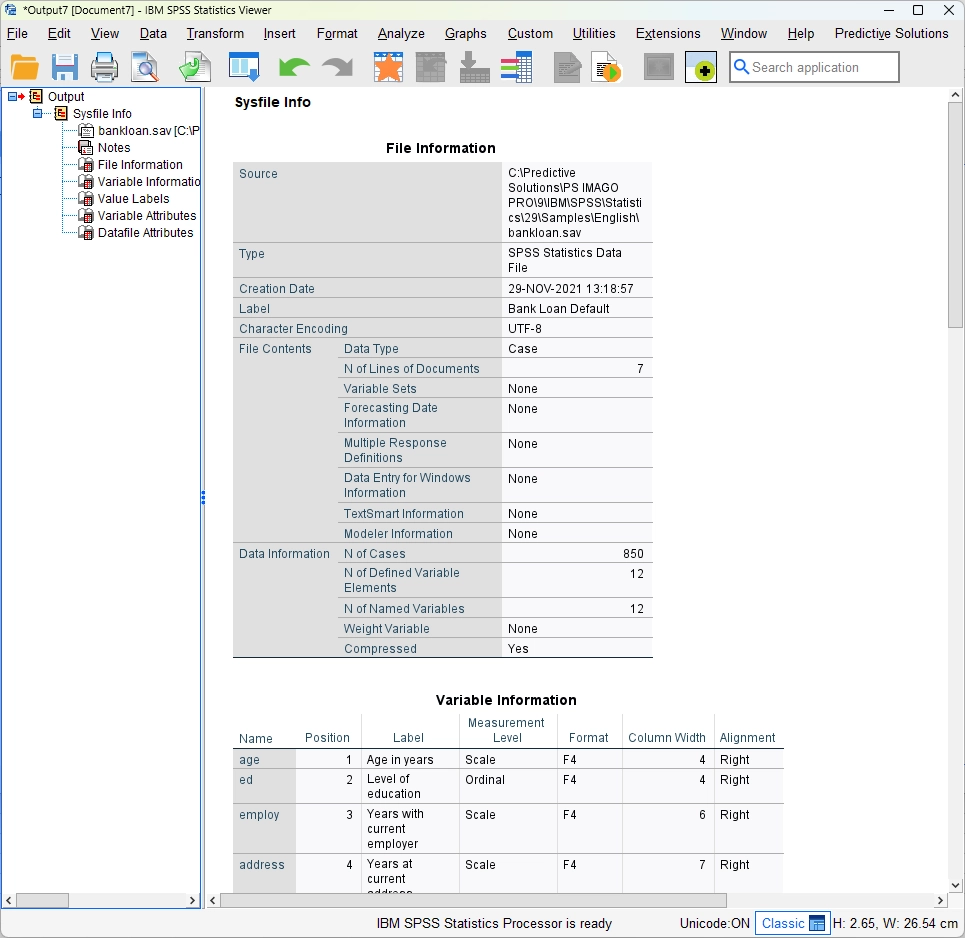
Data inventory – displays information about the data file, variable information, and a list of variable names in the form of a report.
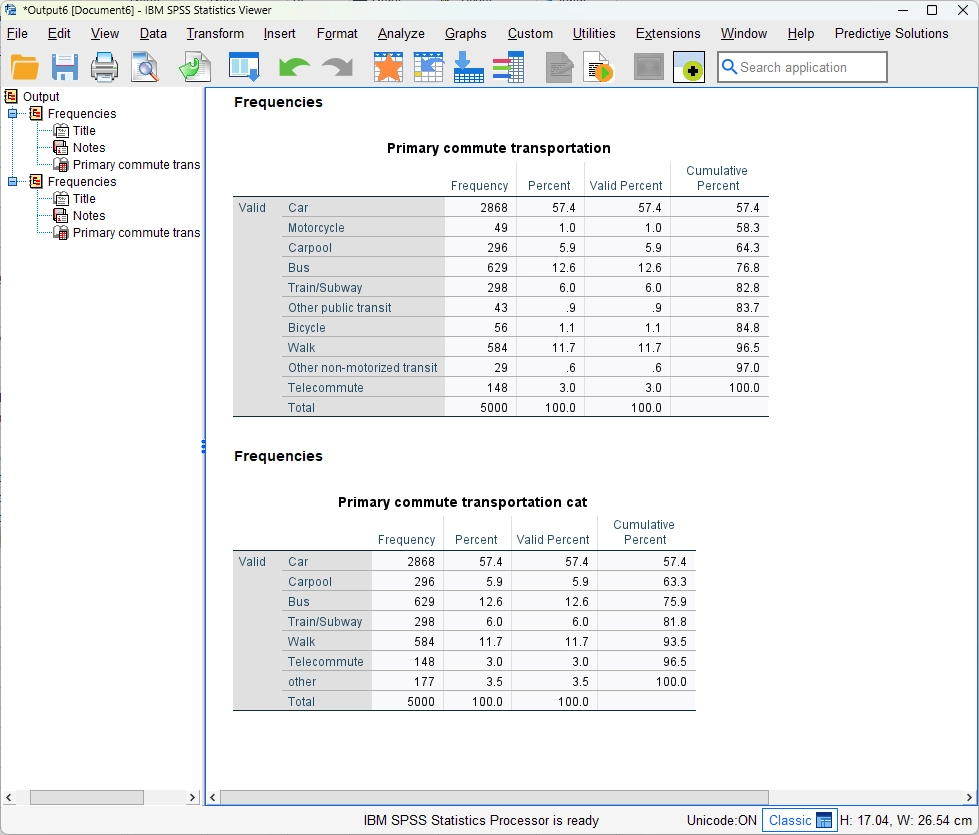
Recode infrequent categories – recodes a variable into a new variable with a smaller number of categories by merging less frequent categories.
Statistical Data Analysis
PS IMAGO PRO also enhances the wide range of IBM SPSS Statistics methods with a variety of additional ones, such as: Cramer’s V Correlated Variables (identifying correlation between independent variables and a dependent variable), Significant Variables Chi-square (verifying the significance of the relationship between independent variables and a dependent variable), Significant Variables CHAID (optimal categorization of independent variables in relation to a dependent variable using the CHAID algorithm), or Data Audit (a summary of selected statistics for numerical and categorical variables), and many others.
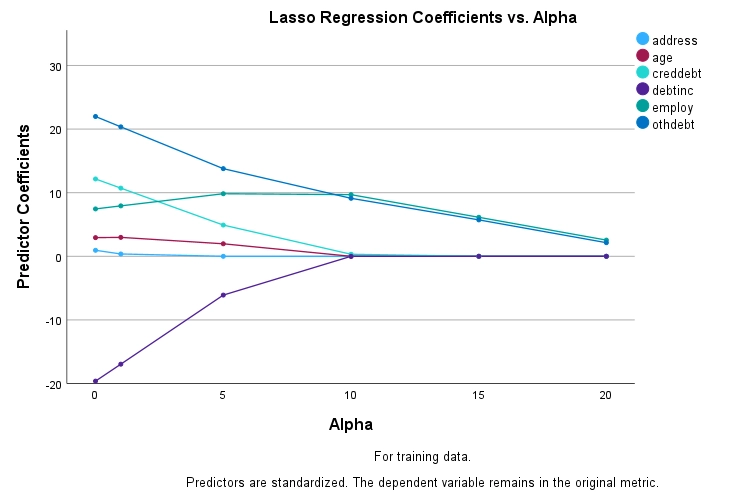
Alternatives to Ordinary Least Squares (OLS) – new types of regression: Lasso, Ridge Regression, and Elastic Net, which are included in the group of regularized regressions.
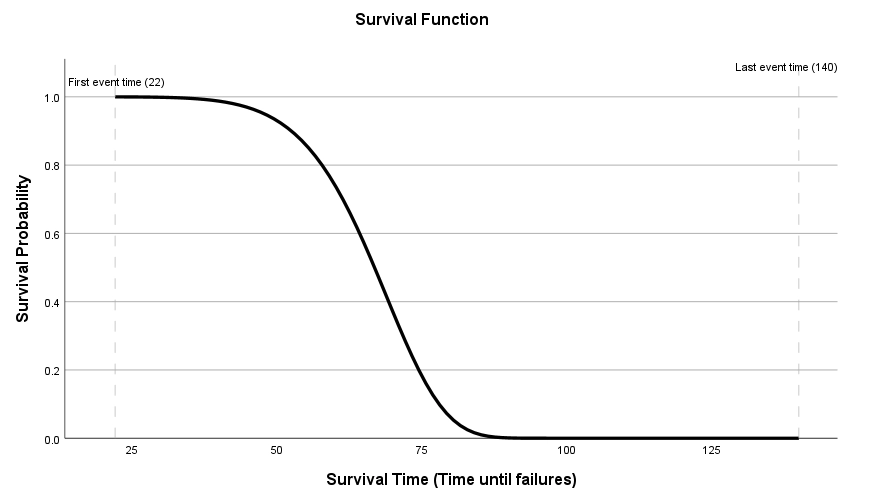
Accelerated Failure Time (AFT) models – a survival analysis that, unlike the popular Kaplan-Meier and Cox regression, is a parametric model.
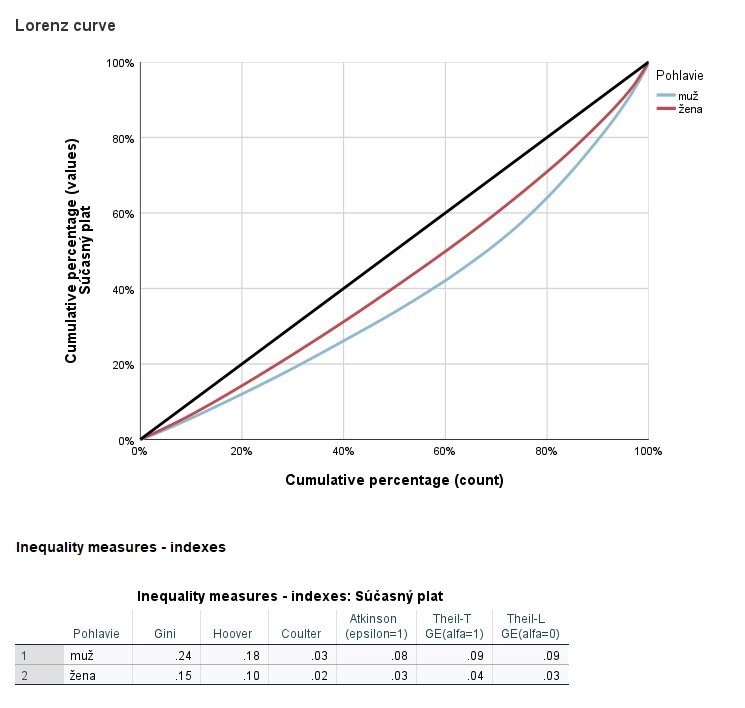
Measures of Disparity – a Lorenz curve illustrating the percentage share of people in total wealth and selected inequality indices.
Reporting and Visualization
Data visualization in PS IMAGO PRO is enhanced by a range of non-traditional charts and map backgrounds. Additionally, the software includes the PS IMAGO Designer component, which allows you to easily create reports from IBM SPSS Statistics outputs using drag-and-drop functionality.
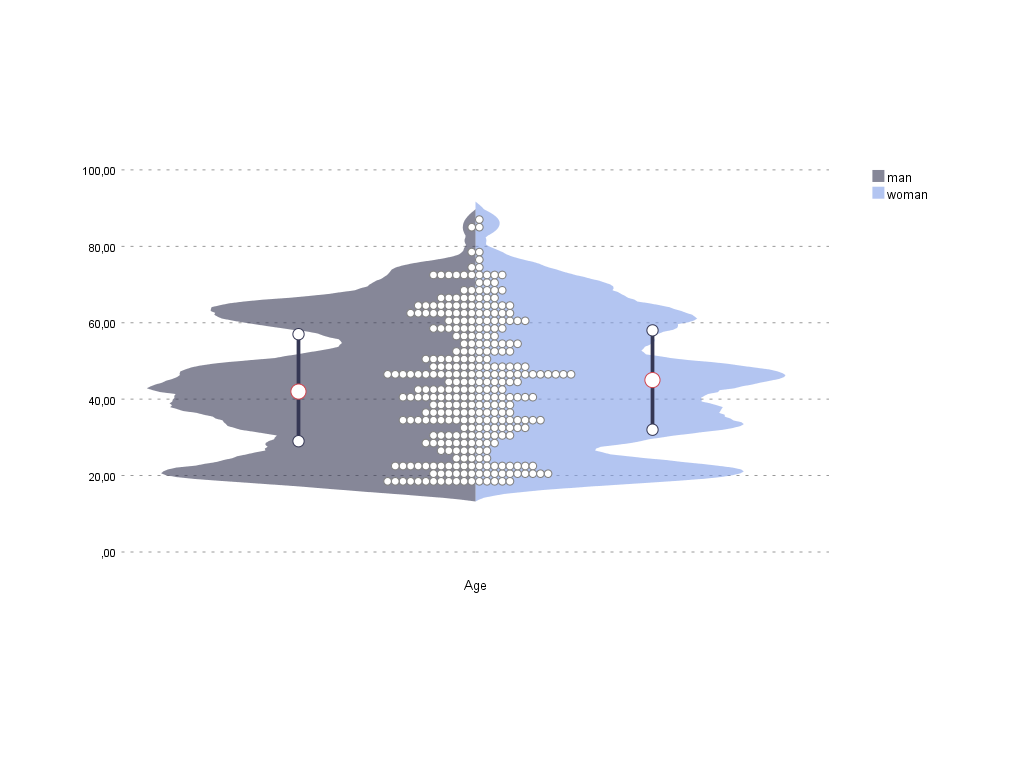
Violin plot chart – a chart for visualizing the distribution of a numerical variable. It is possible to add a categorical variable to observe the distribution within individual groups.
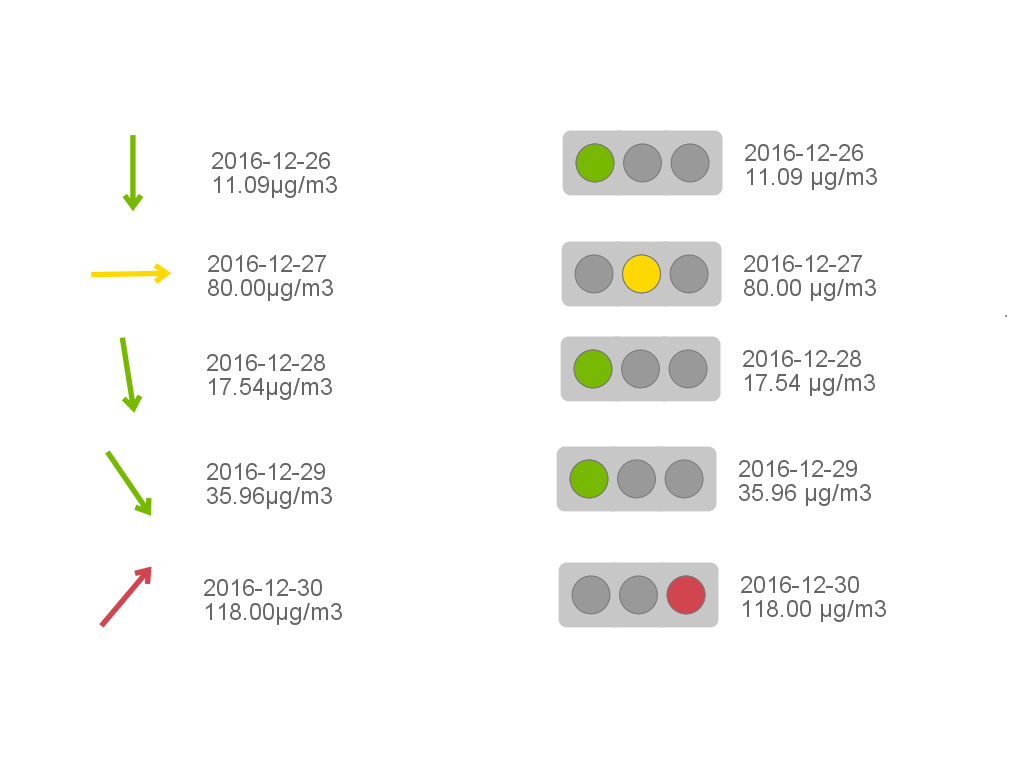
Arrows & Traffic Lights – displays results in the form of arrows or traffic lights. In arrow mode, an arrow is displayed for each category, with its angle of inclination and color depending on the value of a numerical variable.
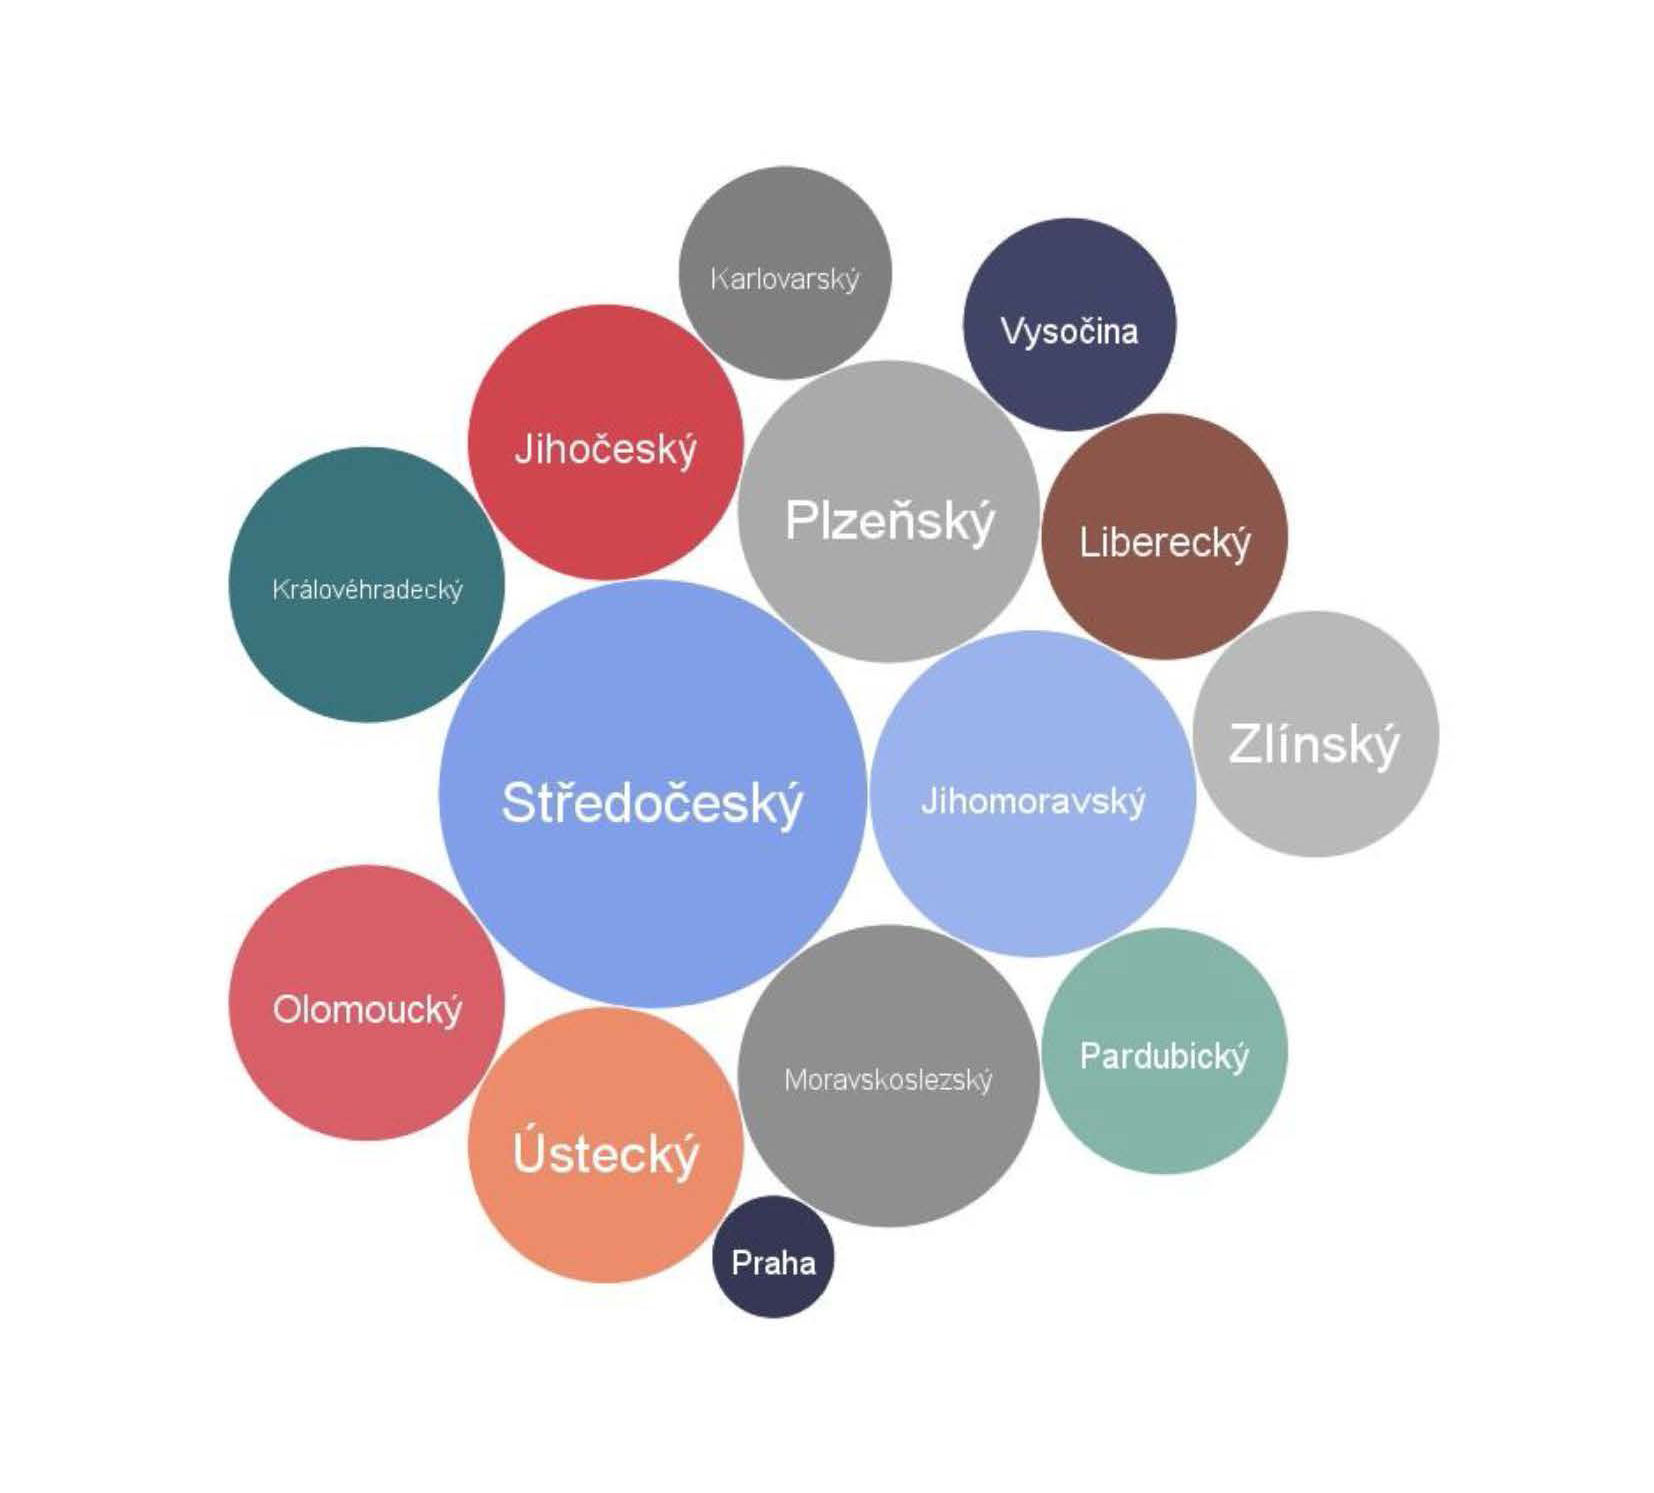
Cloud graph – the frequency of occurrence of a numerical or text variable is reflected in the font size or bubble size of the analyzed variable.
Additional Software Features
PS IMAGO PRO components facilitate the process of reporting and sharing outputs.